Collecting Prometheus metrics from multi-process web servers, the Ruby case
In Prometheus, metrics collection must follow concrete rules. For example, counters must be either always monotonically increasing or reset to zero. Violating this rule will result in collecting nonsensical data.
It is a challenge with multi-process web servers (like Unicorn or Puma in Ruby or Gunicorn in Python) where each scrape might reach a different instance of the app which holds a local copy of the metric[1]. These days, horizontal autoscaling and threaded web servers only increase the complexity of the problem. Typical solutions - implementing synchronization for scrapes or adding extra labels to initiate new time series for every instance of the app - can’t always be implemented.
In this article I describe a rebellious solution of the problem which combines StatsD for metric collection and aggregation with Prometheus for time series storage and data retrieval.
Contents
1. The problem
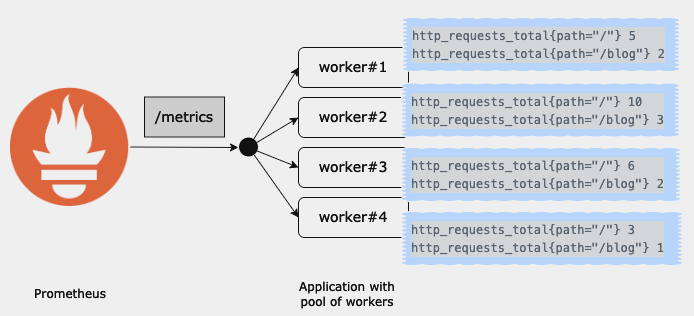
In an ideal world, the target that Prometheus scrapes is a long-living process that has the full picture of the instrumented app. Such a process can infrequently be restarted causing the local registry of metrics to reset. In this world, everything works OK.
However, it gets complicated when the target’s /metrics endpoint is served by a pool of processes (workers or pods). Then, in order to render a full picture of the app at a scrape, processes must have some means of synchronization or other ability to gather the collected data from each other. In other words, the client aggregation becomes a challenge.
This is the reason why the Python Prometheus client uses mmap or the PHP Prometheus client recommends running Redis next to the app instance.[2]
In Ruby space, a lot has been said already. The original GitHub Issue - Support pre-fork servers - was opened on the Feb 8, 2015 and closed on the Jun 25, 2019. The issue was resolved by the introduction of a new data store DirectFileStore - a solution where each process gets a file where it dumps its registry. Then, at a scrape, all files are read so that the data can be aggregated.
I remember watching the thread closely. At that time I was fortunate to work on a Ruby web server running over 100 processes. Unfortunately, switching my (excessively) multi-process app to the new data store made scrapes very slow, eventually leading to timeouts. I wasn’t an outlier, till today I can see that half of the open issues in the prometheus/client_ruby gem relate to DirectFileStore.
Also, the solution requires all the app instances to be able to access the same volume. It puts certain scenarios of horizontal autoscaling in question.
I was forced to look for other solutions, even though I’m still watching issues related to DirectFileStore and I keep my fingers crossed.
Another intuitive solution (which deserves a mention) is to dynamically add an extra label per metric in every app’s instance serving the /metrics endpoint. Such a label uniquely represents the metrics registry. It could be the process PID and/or pod name. However, this is a shortsighted solution soon leading to a blow-up of the total number of time series that Prometheus has to maintain. Adding a volatile label (effectively adding a new time series) is not the right tool for this problem. Especially, when it was not meant to ever group by this label.
2. The proposed solution
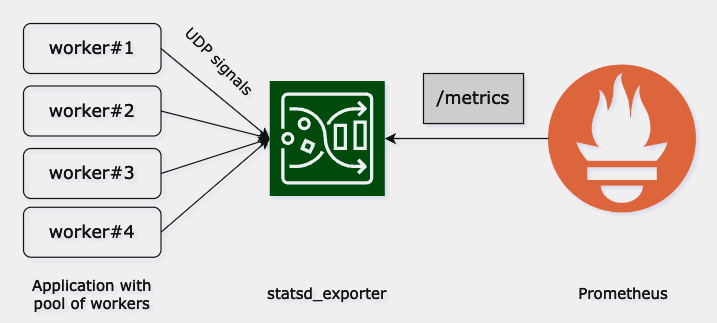
In a nutshell, the proposed solution is to delegate the metrics aggregation to StatsD which then exports metrics in the Prometheus format. I’m not bringing novelty - this bridge has already been implemented as statsd_exporter. It’s been serving me very well in various setups, hence the praise.
2.1. In theory
The key difference between using StatsD instead of Prometheus client is where the aggregation happens. The StatsD client sends UDP packets to the collector which aggregates received signals, while the Prometheus client aggregates metrics in the app’s runtime and then exposes it for scrapes (or sends to the PushGateway).
2.2. In practice
There’re very few changes needed for this solution.
-
deploy the
statsd_exporter; a simpledocker-composebased deployment could include:statsd-exporter: image: prom/statsd-exporter:v0.24.0 # check for the latest ports: - 9102:9102 - 9125:9125/udpIn the future, you might want to add custom configurations, like specific quantiles or label mappings. For more details, check out the Metric Mapping and Configuration section.
- use the statsd-instrument gem in the app;
- make sure that required env vars are provided:
-
STATSD_ADDRshould be set tostatsd-exporter:9125 -
STATSD_ENVshould be set toproduction; if not provided, then StatsD will fallback toRAILS_ENVorENV
-
- now, adding a counter to the codebase is as easy as:
StatsD.increment('rack_server_requests_total', tags: { ... }) - alternatively, for a quick start check out my gem for Rack instrumentation: statsd-rack-instrument
- make sure that required env vars are provided:
-
point Prometheus to scrape the StatsD exporter, add to your
prometheus.yml:scrape_configs: - job_name: statsd static_configs: - targets: - statsd-exporter:9102
That’s it! You should be able to see all metrics delivered via StatsD with this PromQL query:
sum by (__name__) ({job="statsd"})
3. Trade-offs
The proposed solution doesn’t come without costs. As a thought experiment, I came up with three areas on which it can be criticized:
It requires an additional service to be added to your fleet of services
I agree this is a disadvantage. As a matter of fact, if you have a service of 0.99 reliability and you add another service of the same high reliability, then the reliability of your system drops to 0.99 * 0.99 = 0.9801. Yet, I have never encountered any issue with the StatsD server. It has proven to be very reliable.
Incrementing a counter requires sending a UDP packet in contrary to fast in-memory update
On the same note, let me pull the quote from the "Prometheus: Up & Running" book[3]:
Performance is vital for client libraries. This excludes designs where work processes send UDP packets or any other use of networks, due to the system call overhead it would involve. What is needed is something that is about as fast as normal instrumentation, which means something that is as fast as local process memory but can be accessed by other processes.
I fully understand the motivation. Probably it holds true for most of the languages. Yet, at least for Ruby, I think it has proven that the client aggregation isn’t the optimal solution.
Soon, you might have many applications sending metrics to a single StatsD server making it a bottleneck
This is a reminder to add the monitoring of the StatsD server. Even though I think that reaching the scale when it becomes a bottleneck is limited to very few.
4. Final thoughts
Despite the recommendation from the statsd_exporter repository:
We recommend using the exporter only as an intermediate solution, and switching to native Prometheus instrumentation in the long term.
I don’t see the need of migrating from the described solution. If I ever find and migrate to a more suitable solution, then I’ll describe it and update this post.
Currently, the OpenTelemetry project catches a lot of my attention. It offers an integrated approach for gathering app’s signals (logs, metrics, traces). However, the OpenTelemetry Collector doesn’t feature server-side metric aggregation yet - currently it’s an open proposal. Assuming it’s accepted and implemented one day, it may take a long time until it’s available in the client SDKs.
Footnotes
- The problem of collecting metrics from multi-process web servers I know from my own experience, therefore I focus on it. However, I think that collecting metrics from short-living executions (such as GCP functions or AWS labdas) is a sibling problem that might be solved in the same manner.
- It is interesting how seemingly similar problems are approached differently in different languages.
-
Prometheus: Up & Runningby Brian Brazil, ISBN: 9781492034094, page 66.
I have found prom-aggregation-gateway which is also a method for delegating aggregation while still using Prometheus client in the app. To be honest, I haven’t tried it but I feel obliged to mention it in the context of this post.
Get in touch
If for whatever reason you consider it worthwhile to start a conversation with me, please check out the about page to find the available means of communication.