Simple Prometheus queries for metrics inspection
Cardinality is key. And it’s easy to get it out of control, as it is with any instance of the combinatorial explosion.
This, combined with the claim that 90% of metrics are never accessed[1], creates an area worth exploring.
Observability cloud vendors already provide tools allowing to inspect unused data and eventually reduce the cost[2]. But how to get a sense of your metrics when you don’t have access to such tools (i.e. when you run your own Prometheus server)?
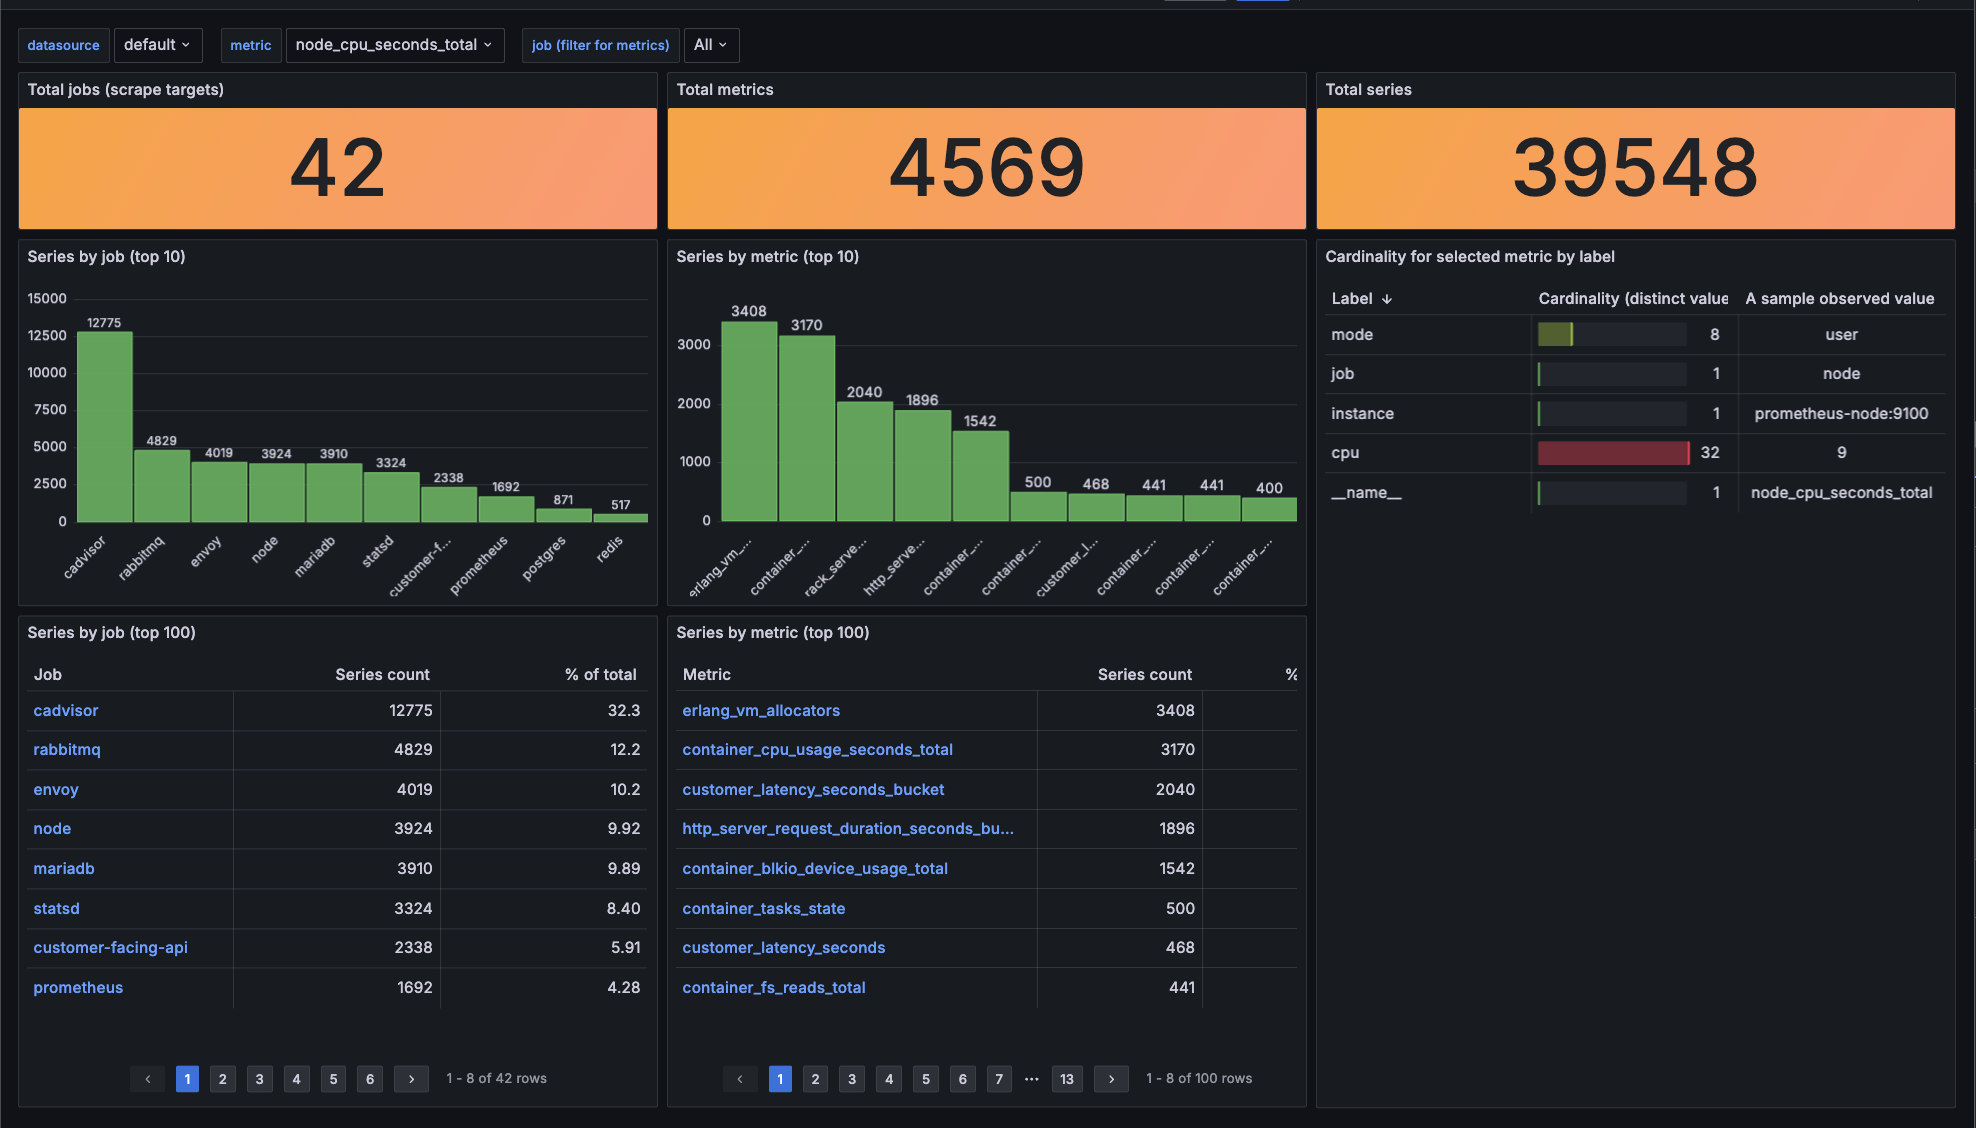
This article proposes a set of simple queries which allow to detect heavy metrics. For a fine illustration of the results, there’s also a Grafana dashboard proposition. A sneak peek of the dashboard is presented on the below screenshot.
Contents
1. A short theory intro
In short, the cardinality of a label is the number of distinct values that were observed. A metric’s cardinality is the number of all observed combinations of labels’ values. In the worst case, it is the product of all labels’ cardinalities.
A fine example is a metric counting HTTP requests having path, method and response_code labels. Let’s consider a scenario in which five paths are observed with three methods and three response codes. Then, the cardinality is 5 * 3 * 3 = 45.
If we decide to make a subtle change and turn this counter into histogram (with 12 buckets), short in time our metric may grow to the cardinality of 45 * 12 = 540.
2. Queries
Beware, when running the queries it’s important to run an instant query, not range query, as for the purpose of this article the last recorded value is enough - we are not interested in the change over time. Querying for a range query may be very slow.
Without further ado, let’s dive into details.
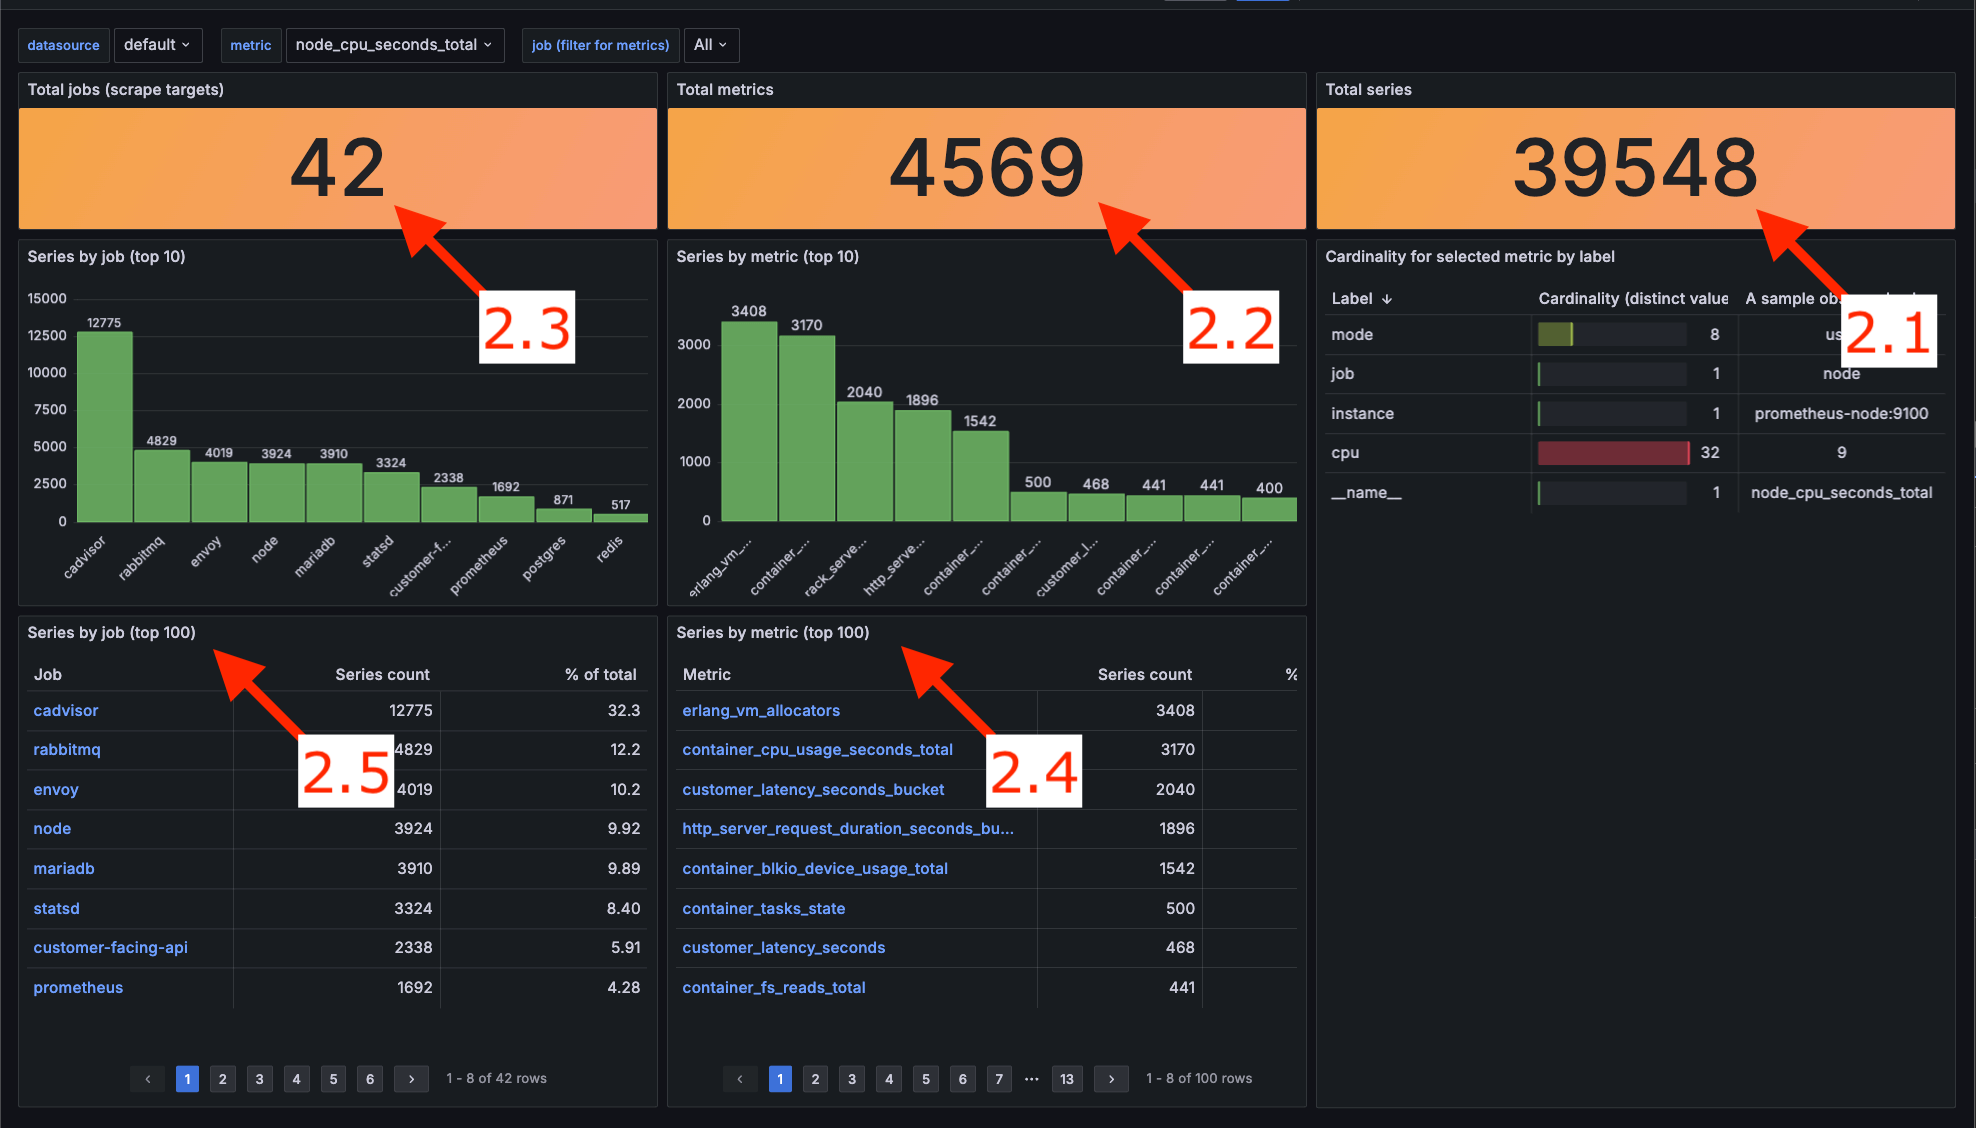
2.1. The count of all series
For starters, let’s pull the total number of series. That is the count of all unique label combinations (including the __name__ label).
count({__name__!=""})
This query relies on one simple rule: Prometheus Query Language (PromQL) requires to provide either a metric name or at least one label matcher. __name__ is an internal label added to every metric with the value of the metric name. As a metric name cannot be empty the !="" expression selects all the metrics.
This powerful concept will be reused in further queries.
2.2. The count of all metrics
Now, let’s check how many metrics our Prometheus instance maintenances.
count(count({__name__!=""}) by (__name__))
Nothing out of ordinary, it’s just a grouping the previous query by __name__ and counting it.
2.3. The count of all jobs
Similarly, let’s check the number of jobs that produce metrics.
count(count({__name__!=""}) by (job))
It’s the same query as the previous just from a different angle - grouped by the job label.
2.4. The count of series per metric
Now let’s zoom in a bit and see more detailed data.
sort_desc(
    count({__name__!=""}) by (__name__)
)
This query outputs the number of series per metric. It is useful to spot metrics with high cardinality. With the sort_desc we can see the most interesting results at the top.
2.5. The count of series per job
Again similarly, let’s change the grouping to job.
sort_desc(
    count({__name__!=""}) by (job)
)
The output shows the number of series per job. It may reveal that a certain job (very often representing a single scraping target) is producing disproportionately many series.
3. Grafana dashboard
Staring at dashboards is amusing. Therefore I couldn’t resist building a dashboard based on the above queries. Besides numbers described above, it has more accompanying calculations, like the percentage that a metric shares out of all series. Check it out at https://grafana.com/grafana/dashboards/19341-prometheus-metrics-management/.[3]
Footnotes
- “Lightstep has studied customers especially for metrics (…) - one in ten metrics is ever queried for any purpose.” Ben Sigelman, Lighstep CEO on OpenObservability Talks, https://www.youtube.com/live/gJhzwP-mZ2k?feature=share&t=1902
- If you are a happy user of Grafana Cloud, check out cardinality management dashboards
- There’s also Gist with the dashboard as a backup https://gist.github.com/michal-kazmierczak/1538bd8df46e4a1fbf9c859bfa045126.
Get in touch
If for whatever reason you consider it worthwhile to start a conversation with me, please check out the about page to find the available means of communication.