Self-hosted observability for Ruby on Rails apps with Kamal and OpenTelemetry
This blog post presents the opentelemetry-rails-example repository — a demo of a fully instrumented Rails application using a self-hosted observability stack deployed with Kamal or Docker Compose.
The post is periodically updated to reflect changes in the telemetry ecosystem, with the latest update in May 2025. For a detailed changelog of the latest updates, scroll to the bottom.
OpenTelemetry has done remarkable work on providing specification of integrated telemetry data as well as on delivering the tooling - instrumentation SDKs for various languages and the OpenTelemetry Collector for data ingestion. However, by design, it doesn’t specify how the data is persisted and accessed. This area is mainly owned by vendors - cloud observability providers who compete in making use of the gathered data by providing all sorts of visualizations and alerting.
Yet, application owners may consider an entirely in-house approach. There are many reasons why one may want to self-host their observability stack. The motivation could be that they want to avoid a $65M bill from the observability tooling provider, or they want to have full control over how and what data is collected, or simply their policy disallows sending the data to a third-party provider.
Regardless of the motivation, I believe it’s worthwhile to know what can be achieved using generally available software that can be self-hosted, as opposed to leveraging observability cloud providers.
I was fortunate to work on implementing observability in numerous Ruby (and Rails) apps from scratch. It involves connecting quite a few moving parts - starting from the application instrumentation, through data ingestion and storage to building up dashboards and alerts - it may be a struggle. As an afterthought, I distilled a minimum stack that gives very powerful insights into the system’s performance. The stack can be deployed with Kamal or as a Docker Compose cluster.
For details, check out this repository: -> opentelemetry-rails-example <-

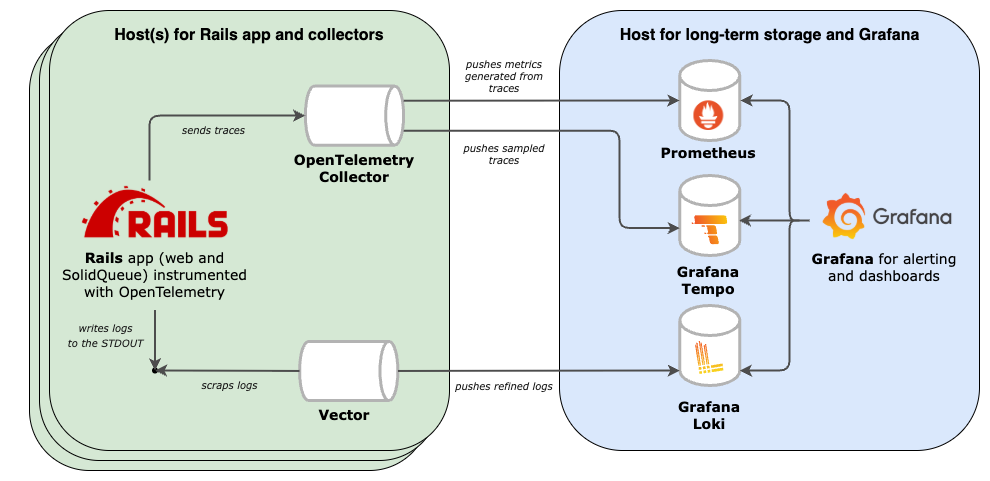
The example stack covers three main layers of the system observability:
- Instrumentation of the app (using the OpenTelemetry SDK, but not only);
- Collection, processing, and export of the observability data (handled by OpenTelemetry Collector and Vector);
- Storage and access with Prometheus, Loki and Tempo for the storage and Grafana for seamless navigation between logs, metrics and traces.
Of course, it all comes with costs. Production deployments may need tuning and sampling to limit the infrastructure burden. Business-wise, with an in-house stack, the luxury of logs, metrics, and traces doesn’t have to connote an enormous bill from a third-party observability provider.
By adapting the in-house approach development teams may benefit from an integrated instrumention while having a better understanding of data and a better control over the costs. I believe it’s worth the effort - debugging a system with traversable logs, metrics, and traces is mentally easier and more efficient, especially when the time is critical.
Major updates
May 2025
Roughly a year after the publication of this project, I’ve gathered feedback received via e-mail and CNCF Slack (thank you!) and refreshed the stack to better serve a broader audience. Most notable updates:
- Kamal deployment added
- Improved portability through wider adoption of the OpenTelemetry Collector for metrics and traces, and replacement of Promtail with Vector for log collection
- Replacing Sidekiq with SolidJob, and more importantly, moving instrumentation to ActiveJob to support any background processing backend
- Rails version was upgraded to 8 and Ruby to 3.4
Get in touch
If for whatever reason you consider it worthwhile to start a conversation with me, please check out the about page to find the available means of communication.