<?xml version="1.0" encoding="utf-8"?><feed xmlns="http://www.w3.org/2005/Atom" xml:lang="en"><generator uri="https://jekyllrb.com/" version="4.4.1">Jekyll</generator><link href="https://mkaz.me/feed.xml" rel="self" type="application/atom+xml"/><link href="https://mkaz.me/" rel="alternate" type="text/html" hreflang="en"/><updated>2026-01-14T12:40:00+00:00</updated><id>https://mkaz.me/feed.xml</id><title type="html">blank</title><subtitle>Software developer, passionate about observability of distributed and transactional systems </subtitle><entry><title type="html">What makes Don’t Make Me Think timeless?</title><link href="https://mkaz.me/blog/2026/what_makes_dont_make_me_think_timeless/" rel="alternate" type="text/html" title="What makes Don’t Make Me Think timeless?"/><published>2026-01-12T18:30:00+00:00</published><updated>2026-01-12T18:30:00+00:00</updated><id>https://mkaz.me/blog/2026/what_makes_dont_make_me_think_timeless</id><content type="html" xml:base="https://mkaz.me/blog/2026/what_makes_dont_make_me_think_timeless/"><![CDATA[<p><img src="/assets/img/2026-01-12-what-makes-dont-make-me-think-timeless/IMG_1819.jpeg" alt="copy of Don't Make Me Think" style="max-width: 100%"/></p> <p>Recently, I’ve been re-reading books that I enjoyed in the past. Often the second read is better: you notice patterns and principles you missed the first time.</p> <p>By doing so, it struck me how much wisdom can be found in relatively old texts. Most books don’t age well, though. This is especially true in the tech field, where very few books stand out the test of time.</p> <p><em>Don’t Make Me Think</em> by Steve Krug is an exception. Originally published in 2000 (!), revisited in 2014 it remains a great reference for anyone interested in building user interfaces.</p> <p>Below are five core usability principles from the book and why they remain relevant.</p> <p><br/></p> <h2 id="five-principles-of-web-usability">Five Principles of Web Usability</h2> <p><br/></p> <h3 id="1-users-dont-read-they-scan">1. Users don’t read; they scan.</h3> <p>Users are constantly in hurry. As a result, they don’t have the time to read websites so they are scanning them until they find anything that catches their attention or a link that may navigate them to something that they are looking for. This isn’t an optimal choice. That’s <a href="https://en.wikipedia.org/wiki/Satisficing" target="_blank">satisficing</a>: choosing a “good enough” option quickly rather than searching for an optimal one. This behaviour lies at the core of human decision making.</p> <p>Website creators who spend hours on polishing their distinguished texts or on organizing long lists of links on the home page must be disappointed. It’s way more effective to focus on aspects of a site that make it <strong>easy to skim</strong>. The book shows how!</p> <p><br/></p> <h3 id="2-eliminate-question-marks">2. Eliminate question marks.</h3> <p>If I were to pick one quote from the book, it would be:</p> <blockquote> <p>The most important thing you can do is to understand the basic principle of eliminating question marks. When you do, you’ll begin to notice all the things that make you think in the sites and apps you use. And eventually you’ll learn to recognize and avoid them in the things you’re building.</p> </blockquote> <p>Question marks are all elements on the interface that <strong>make us think</strong>.</p> <blockquote> <p><em>Can I click it? Is this a link? Is this a form field? What’s the scope of this search? How do I start over?</em></p> </blockquote> <p>Any such question that appears in users’ minds for a split of a second leads to a confusion. And every confusion needs a recovery work - very often a trial and failure. Accumulating confusions leads to frustration and general lack of confidence in how to use the site. And as the general rule says, anything that requires a large cognitive investment is less likely to be used.</p> <p><br/></p> <h3 id="3-a-few-mindless-clicks-beat-one-hard-click">3. A few mindless clicks beat one hard click.</h3> <p>This might be counterintuitive at first. Why clicking, say, three times to reach the desired page might be better than a single click? Shouldn’t we optimize for as few clicks as possible? It turns out that more clicks are better if these are effortless and users are confident that they are on the right track. It wins over a single click that requires more effort.</p> <p>It’s connected with the second principle. Very often eliminating question marks boils down to removing unnecessary UI elements. This way you can reduce the noise and accent things that are essential on the page. Leaving users with fewer but more relevant choices makes the site <strong>easier to use</strong>.</p> <p>Of course, too much clicks might become frustrating. The author provides the following formula:</p> <blockquote> <p>(…) three mindless, unambiguous clicks equal one click that requires thought.</p> </blockquote> <p><br/></p> <h3 id="4-most-arguments-about-web-usability-are-a-waste-of-time">4. Most arguments about web usability are a waste of time.</h3> <p>If you ever find yourself discussing drop downs versus radio buttons, stop. It’s a dead end. Discussions about usability fall into the same category as discussions about religion or politics: the ultimate truth can’t be proven. It may be very draining and cause unnecessary erode of respect between involved parties. Also, these seldom result in anyone changing their opinion (even if someone admits the opposite!).</p> <p>A better use of time is <strong>usability testing</strong>. It replaces opinions with evidence from real users using the website and often shifts the conversation by exposing larger, previously unseen problems.</p> <p>The book provides a simplified framework for conducting usability testing. For a more in-depth reference, check out Steve Krug’s book dedicated to this topic: <em>Rocket Surgery Made Easy</em>.</p> <p><br/></p> <h3 id="5-watch-real-people-use-what-you-build">5. Watch real people use what you build.</h3> <p><img src="/assets/img/2026-01-12-what-makes-dont-make-me-think-timeless/usability_testing.jpg" alt="Comic illustrating usability testing" style="max-width: 100%"/></p> <p>Each time I observed someone using an interface I had built, their behaviour surprised me. A few times my mental model of how a user would interact with the interface was extremely off. I guess spending hours on something completely deprives the ability to look at it from an end users perspective.</p> <p>This is where delegation becomes essential. Hire someone and give them a concrete task to accomplish on your site. <strong>Watch closely</strong>, notice every small confusion or misinterpretation. That direct observation is the fastest path to meaningful improvements. Soon, you might become addicted to it as you realize that every such session improves the usability in a way you wouldn’t think of on your own.</p> <p><br/></p> <h2 id="so-what-makes-dont-make-me-think-timeless">So, what makes <em>Don’t Make Me Think</em> timeless?</h2> <p>The reason the book remains relevant is its focus on <strong>human behaviour</strong>, rather than tools or trends.</p> <p>The author examined the deeply wired habits that determine how we interact with computers. This let him get the essence of what improves or degrades usability.</p> <p><br/> Chapter 12 about accessibility ends with:</p> <blockquote> <p>When I wrote this chapter seven years ago, it ended with this:</p> <p>“Hopefully in five years I’ll be able to just remove this chapter and use the space for something else because the developer tools, browsers, screen readers, and guidelines will all have matured and will be integrated to the point where people can build accessible sites without thinking about it.”</p> <p>Sigh.</p> <p>Hopefully we’ll have better luck this time.</p> </blockquote> <p>If Steve would revisit it now, twelve years since the last edit, he still couldn’t free this space up. Despite the development of great HTML and CSS libraries, accessibility is still tough and it’s not a solved problem. But for our point forward, it only proves that the book very well stands out the test of time.</p>]]></content><author><name></name></author><category term="Recaps"/><category term="Books"/><category term="Web"/><category term="Usability"/><summary type="html"><![CDATA[Most books in the tech field age fast. However, when I recently re-read Don’t Make Me Think by Steve Krug, I was struck by how little it had aged. So, what makes it still relevant?]]></summary></entry><entry><title type="html">SLO formulas implementation in PromQL step by step</title><link href="https://mkaz.me/blog/2024/slo-formulas-implementation-in-promql-step-by-step/" rel="alternate" type="text/html" title="SLO formulas implementation in PromQL step by step"/><published>2024-03-25T08:30:00+00:00</published><updated>2024-03-25T08:30:00+00:00</updated><id>https://mkaz.me/blog/2024/slo-formulas-implementation-in-promql-step-by-step</id><content type="html" xml:base="https://mkaz.me/blog/2024/slo-formulas-implementation-in-promql-step-by-step/"><![CDATA[<h2 id="theory">Theory</h2> <p>In engineering, perfection isn’t optimal. Even though a service that is continuously up and always responds with the expected latency<sup><a href="#footnotes">[1]</a></sup> might sound desirable, it would require too expensive resources and overly conservative practices. To maintain the expectations and prioritize engineering resources, it’s common to define and publish <strong>Service Level Objectives (SLO)</strong>.</p> <p>An <strong>SLO defines the tolerable ratio of measurements meeting the target value to all measurements recorded within a specified time interval.</strong></p> <p>To break it down, I believe that a properly formulated <strong>SLO</strong> consists of four segments:</p> <ol> <li>Definition of the metric (what’s being measured).</li> <li>Target value.</li> <li>Anticipated ratio of good (meeting the target) to all measurements, typically expressed in percentages.</li> <li>Time interval over which the SLO is considered.</li> </ol> <p>A simple <strong>availability SLO</strong> could be:</p> <ul> <li><code class="language-plaintext highlighter-rouge">a service is up 99.99% of the time over a week period</code> <ul> <li>the metric is <em>the service availability</em> (implicit)</li> <li>the target value is that it’s <em>up</em></li> <li>the anticipated good to all ratio is <em>99.99%</em></li> <li>the considered time interval is <em>week</em></li> </ul> </li> </ul> <p>An example of <strong>latency SLO</strong> could be:</p> <ul> <li><code class="language-plaintext highlighter-rouge">the latency of 99% of requests is less than or equal 250ms over a week period</code> <ul> <li>the metric is the <em>requests latency</em></li> <li>the target value is <em>less than or equal 250ms</em></li> <li>the anticipated good to all ratio is <em>99%</em></li> <li>the considered time interval is <em>week</em></li> </ul> </li> </ul> <p>Having an SLO defined, a service operator needs to deliver a calculation that tells the reality. The remainder of this article is a step by step guide on how to implement availability and latency SLO formulas with the Prometheus monitoring system.</p> <hr/> <p><br/></p> <h2 id="practice---slo-formulas-with-promql-step-by-step">Practice - SLO formulas with PromQL step by step</h2> <p>There are plenty of resources out there about SLO calculation. Moreover, there are off-the-shelf solutions for getting SLOs from metrics<sup><a href="#footnotes">[2]</a></sup>. <br/> OK then, why add one more resource on the topic? I want to present real-life examples of both availability and latency SLOs, as they are more nuanced than they may initially appear. Also, I find it worthwhile sharing a detailed guide as it showcases uncommon uses of PromQL and demonstrates the language’s versatility.</p> <p><br/></p> <h3 id="formula-for-availability-slo">Formula for availability SLO</h3> <p>Let’s look again at our SLO:</p> <div class="language-plaintext highlighter-rouge"><div class="highlight"><pre class="highlight"><code>A service is up 99.99% of the time over a week period.
</code></pre></div></div> <p>To reason about a service’s availability we need a metric that indicates whether a service is up or down. Additionally, we need to sample this metric at regular time intervals. This allows us to divide the count of samples when the service reported as up by the count of all time intervals in the observed period. This gives us our SLO.</p> <p>Prometheus delivers the <code class="language-plaintext highlighter-rouge">up</code> metric (quite an accurate naming) for every scrape target. It’s a gauge which reports <code class="language-plaintext highlighter-rouge">1</code> when the scrape succeeded and <code class="language-plaintext highlighter-rouge">0</code> if the scrape failed. Given its simplicity, it’s a very good proxy of the service’s availability (however, it’s still prone to false negatives and false positives).</p> <p>Let’s consider the following plot of an <code class="language-plaintext highlighter-rouge">up</code> metric:</p> <p><a href="/assets/img/2024-03-25-a-promql-query-for-slo-calculation-explained/up_my_service.png"> <img src="/assets/img/2024-03-25-a-promql-query-for-slo-calculation-explained/up_my_service.png" alt="plot for the up metric" style="max-width: 100%"/> </a></p> <p>
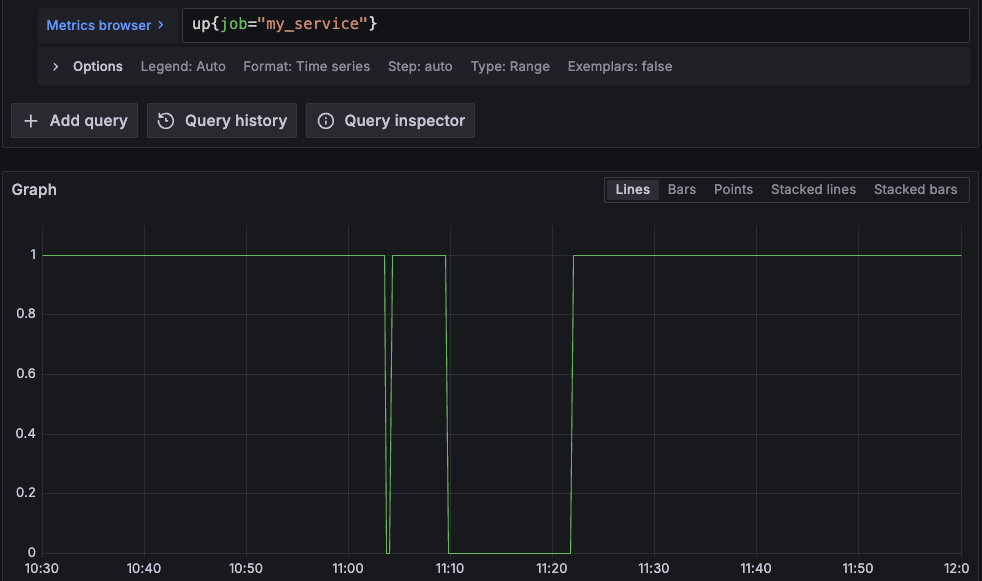
This service was sampled every 15s. The time range is from 10:30:00 to 12:00:00 (1h30m inclusive - 361 samples). We can observe two periods when the service was down: <code class="language-plaintext highlighter-rouge">from 11:03:45 to 11:04:00</code> and <code class="language-plaintext highlighter-rouge">from 11:09:45 to 11:21:45</code>. This gives us <code class="language-plaintext highlighter-rouge">2 + 49 = 51</code> samples missing the target and <code class="language-plaintext highlighter-rouge">361 - 51 = 310</code> samples meeting the target. <br/> Therefore the SLO is <code class="language-plaintext highlighter-rouge">(310 / 361) * 100 = 85.87%</code>. How to get this number with PromQL? Intuitively, we could count good samples and all samples (with <code class="language-plaintext highlighter-rouge">count_over_time</code>), and then calculate the ratio. However, given that the <code class="language-plaintext highlighter-rouge">up</code> metric is a gauge reporting either <code class="language-plaintext highlighter-rouge">0</code> or <code class="language-plaintext highlighter-rouge">1</code> we can do a trick and use the <code class="language-plaintext highlighter-rouge">avg_over_time</code> function:</p> <div class="language-plaintext highlighter-rouge"><div class="highlight"><pre class="highlight"><code>avg_over_time(
    up{job="my_service"}[90m:]
) * 100
=&gt; 85.87257617728531
</code></pre></div></div> <p>For production readiness, I recommend using <a target="_blank" href="https://prometheus.io/docs/prometheus/latest/querying/api/#instant-queries">instant query</a> and adjust the range. Also, see the footnotes if you suffer from periodic metric absence<sup><a href="#footnotes">[3]</a></sup>.</p> <p><br/></p> <h3 id="formula-for-latency-slo">Formula for latency SLO</h3> <p>Let’s recity our latency SLO:</p> <div class="language-plaintext highlighter-rouge"><div class="highlight"><pre class="highlight"><code>The latency of 99% of requests is less than or equal 250ms over a week period.
</code></pre></div></div> <p>For an accurate calculation, we need the count of requests that took less than or 250ms and the count of all requests. It turns out that it is a rare luxury, though. It actually means that you either have:</p> <ul> <li>the service instrumented upfront with a counter that increments when a request takes less than or 250ms, along with another counter that increments for every request;</li> <li>a histogram metric with one of the buckets set to <code class="language-plaintext highlighter-rouge">0.25</code>, which is the same as the first point as a histogram is essentially a set of counters.</li> </ul> <p>Assuming you have the histogram metric with the <code class="language-plaintext highlighter-rouge">0.25</code> bucket, the query is:</p> <div class="language-plaintext highlighter-rouge"><div class="highlight"><pre class="highlight"><code>sum(
  increase(http_request_latency_seconds_bucket{job="my_service",le="0.25"}[7d])
) * 100 /
sum(
  increase(http_request_latency_seconds_bucket{job="my_service",le="+Inf"}[7d])
)
=&gt; 99.958703283089
</code></pre></div></div> <p>Ok, but what to do when such counters aren’t available?</p> <p><br/></p> <h3 id="formula-for-latency-slo-with-percentiles">Formula for latency SLO with percentiles</h3> <p>Another approach to latency SLOs is setting expectations regarding percentiles, which is a common real-life example. It gives the flexibility in testing different target values without the need of re-instrumentation. However, I suggest to refrain from relying solely on percentiles in SLOs for several reasons:</p> <ul> <li>it’s an aggregate view, so it may hide certain characteristics of the service; a ratio of two counters offers way more straightforward understanding;</li> <li>combining percentiles from different services can be tricky; for example, averaging percentiles is possible only for services having the same latency distribution (almost impossible) or by calculating a weighted average (also almost impossible);</li> <li>the SLO gets more complicated, making it difficult to reason about — especially for non-SRE people who are also users of the SLO.</li> </ul> <p>Nonetheless, an example of such an SLO is:</p> <div class="language-plaintext highlighter-rouge"><div class="highlight"><pre class="highlight"><code>99th percentile of requests latency is lower than 400ms 99% of the time over a week period.
</code></pre></div></div> <p>It can be implemented in PromQL in three steps:</p> <ol> <li>Calculate the quantile: <div class="language-plaintext highlighter-rouge"><div class="highlight"><pre class="highlight"><code>histogram_quantile(
  0.99,
  sum by (le) (rate(http_server_request_duration_seconds_bucket[1m]))
)
</code></pre></div> </div> <p><a href="/assets/img/2024-03-25-a-promql-query-for-slo-calculation-explained/99th_quantile.png"> <img src="/assets/img/2024-03-25-a-promql-query-for-slo-calculation-explained/99th_quantile.png" alt="plot for the up metric" style="max-width: 100%"/> </a></p> </li> <li>
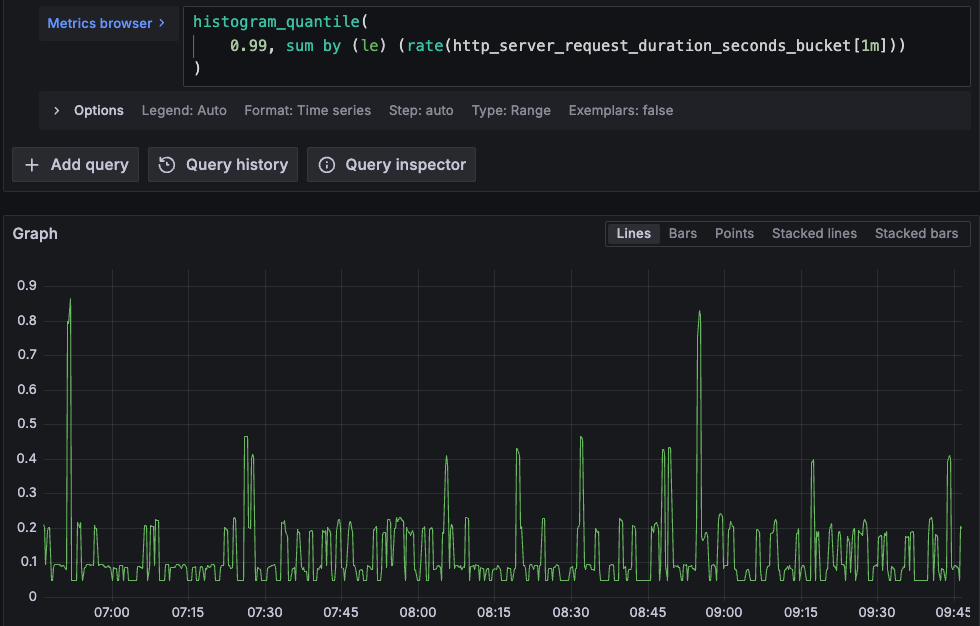
Perform a binary quantization to get a vector of <code class="language-plaintext highlighter-rouge">1</code> and <code class="language-plaintext highlighter-rouge">0</code> values corresponding to when the target value is met and not met. It’s a perfect input for our <code class="language-plaintext highlighter-rouge">avg_over_time</code> function. This is achieved with the <code class="language-plaintext highlighter-rouge">bool</code> modifier (<code class="language-plaintext highlighter-rouge">&lt;bool 0.4</code>). <div class="language-plaintext highlighter-rouge"><div class="highlight"><pre class="highlight"><code>histogram_quantile(
  0.99,
  sum by (le) (rate(http_server_request_duration_seconds_bucket[1m]))
) &lt;bool 0.4
</code></pre></div> </div> <p><a href="/assets/img/2024-03-25-a-promql-query-for-slo-calculation-explained/99th_quantile_with_binary_quantization.png"> <img src="/assets/img/2024-03-25-a-promql-query-for-slo-calculation-explained/99th_quantile_with_binary_quantization.png" alt="plot for the up metric" style="max-width: 100%"/> </a></p> </li> <li>
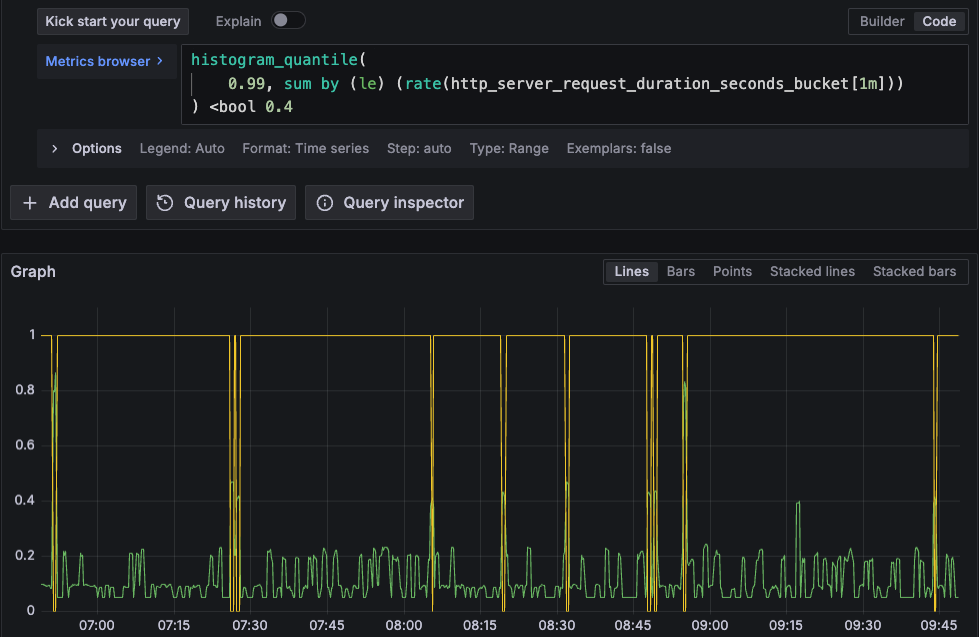
Calculate the percentage: <div class="language-plaintext highlighter-rouge"><div class="highlight"><pre class="highlight"><code>avg_over_time(
  (histogram_quantile(
    0.99,
    sum by (le) (rate(http_server_request_duration_seconds_bucket[1m]))
  ) &lt;bool 0.4)[7d:]
) * 100
=&gt; 96.66666666666661
</code></pre></div> </div> </li> </ol> <hr/> <p>When you finish prototyping with any of the above formulas, it’s a good practice to define a recording rule for the main metric for an efficient evaluation.</p> <hr/> <h2 id="footnotes">Footnotes</h2> <ol> <li>In this article, ‘latency’ refers to the time it takes for the service to generate a response. I want to clarify it because in some resources it’s used as the time that a request is waiting to be handled.</li> <li>On this note, I highly recommend getting familiar with <a target="_blank" href="https://github.com/pyrra-dev/pyrra/">Pyrra</a>.</li> <li>It’s a common issue that the DB misses certain samples when the monitoring is hosted on the same server as the service having problems. While rethinking the architecture would be ideal, a quick workaround is to reduce all labels from the <code class="language-plaintext highlighter-rouge">up</code> metric and <em>fill the gap</em> with the scalar <code class="language-plaintext highlighter-rouge">vector(0)</code>. Beware, the consequence is that the absence of the metric is seen as the service being down. <div class="language-plaintext highlighter-rouge"><div class="highlight"><pre class="highlight"><code>avg_over_time(
  (sum(up{job="my_service"}) or vector(0))[90m:]
) * 100
</code></pre></div> </div> </li> </ol> ]]></content><author><name></name></author><category term="monitoring"/><category term="Prometheus"/><category term="PromQL"/><category term="SLO"/><category term="SLI"/><category term="availability"/><category term="latency"/><summary type="html"><![CDATA[The service level terminology provides a framework for quantifying the quality of a service's reliability. There are plenty of resources available on SLI, SLO, and SLA, most theorizing. This article proposes PromQL implementations for availability and latency SLOs.]]></summary></entry><entry><title type="html">Self-hosted observability for Ruby on Rails apps with Kamal and OpenTelemetry</title><link href="https://mkaz.me/blog/2024/self-hosted-overvability-for-ruby-on-rails-apps-with-kamal-and-opentelemetry/" rel="alternate" type="text/html" title="Self-hosted observability for Ruby on Rails apps with Kamal and OpenTelemetry"/><published>2024-01-24T18:18:00+00:00</published><updated>2024-01-24T18:18:00+00:00</updated><id>https://mkaz.me/blog/2024/self-hosted-overvability-for-ruby-on-rails-apps-with-kamal-and-opentelemetry</id><content type="html" xml:base="https://mkaz.me/blog/2024/self-hosted-overvability-for-ruby-on-rails-apps-with-kamal-and-opentelemetry/"><![CDATA[<blockquote> <p>This blog post presents the <strong><a href="https://github.com/michal-kazmierczak/opentelemetry-rails-example" target="_blank">opentelemetry-rails-example</a></strong> repository — a demo of a fully instrumented Rails application using a self-hosted observability stack deployed with Kamal or Docker Compose. <br/> The post is periodically updated to reflect changes in the telemetry ecosystem, with the latest update in May 2025. For a detailed changelog of the latest updates, <a href="#major-updates">scroll to the bottom</a>.</p> </blockquote> <p><a href="https://opentelemetry.io/" target="_blank">OpenTelemetry</a> has done remarkable work on providing specification of integrated telemetry data as well as on delivering the tooling - <a href="https://opentelemetry.io/ecosystem/registry" target="_blank">instrumentation SDKs</a> for various languages and the <a href="https://github.com/open-telemetry/opentelemetry-collector" target="_blank">OpenTelemetry Collector</a> for data ingestion. However, by design, it doesn’t specify how the data is persisted and accessed. This area is mainly owned by vendors - cloud observability providers who compete in making use of the gathered data by providing all sorts of visualizations and alerting.</p> <p>Yet, application owners may consider an entirely in-house approach. There are many reasons why one may want to self-host their observability stack. The motivation could be that they want to avoid a <a href="https://news.ycombinator.com/item?id=35837330" target="_blank">$65M bill</a> from the observability tooling provider, or they want to have full control over how and what data is collected, or simply their policy disallows sending the data to a third-party provider.</p> <p>Regardless of the motivation, I believe it’s worthwhile to know what can be achieved using generally available software that can be self-hosted, as opposed to leveraging observability cloud providers.</p> <hr/> <p>I was fortunate to work on implementing observability in numerous Ruby (and Rails) apps from scratch. It involves connecting quite a few moving parts - starting from the application instrumentation, through data ingestion and storage to building up dashboards and alerts - it may be a struggle. As an afterthought, I distilled a minimum stack that gives very powerful insights into the system’s performance. The stack can be deployed with Kamal or as a Docker Compose cluster.</p> <p>For details, check out this repository: <strong class="text-nowrap">-&gt; <a href="https://github.com/michal-kazmierczak/opentelemetry-rails-example" target="_blank">opentelemetry-rails-example</a> &lt;-</strong></p> <p><a href="https://github.com/michal-kazmierczak/opentelemetry-rails-example/raw/main/docs/otel_rails.gif" target="_blank"> <img src="https://github.com/michal-kazmierczak/opentelemetry-rails-example/raw/main/docs/otel_rails.gif" alt="ruby on rails and opentelemetry" style="max-width: 100%"/> </a></p> <hr/> <p>The example stack covers three main layers of the system observability:</p> <ul> <li><strong>Instrumentation</strong> of the app (using the OpenTelemetry SDK, but not only);</li> <li><strong>Collection, processing, and export</strong> of the observability data (handled by OpenTelemetry Collector and Vector);</li> <li><strong>Storage and access</strong> with Prometheus, Loki and Tempo for the storage and Grafana for seamless navigation between logs, metrics and traces.</li> </ul> <p><a href="https://raw.githubusercontent.com/michal-kazmierczak/opentelemetry-rails-example/main/docs/rails_observability.drawio.png" target="_blank"> <img src="https://raw.githubusercontent.com/michal-kazmierczak/opentelemetry-rails-example/main/docs/rails_observability.drawio.png" alt="ruby on rails and opentelemetry" style="max-width: 100%"/> </a></p> <hr/> <p>Of course, it all comes with costs. Production deployments may need tuning and sampling to limit the infrastructure burden. Business-wise, with an in-house stack, the luxury of logs, metrics, and traces doesn’t have to connote an enormous bill from a third-party observability provider.</p> <p>By adapting the in-house approach development teams may benefit from an integrated instrumention while having a better understanding of data and a better control over the costs. I believe it’s worth the effort - debugging a system with traversable logs, metrics, and traces is mentally easier and more efficient, especially when the time is critical.</p> <hr/> <h2 id="major-updates">Major updates</h2> <h3>May 2025</h3> <p>Roughly a year after the publication of this project, I’ve gathered feedback received via e-mail and CNCF Slack (thank you!) and refreshed the stack to better serve a broader audience. Most notable updates:</p> <ul> <li>Kamal deployment added</li> <li>Improved portability through wider adoption of the OpenTelemetry Collector for metrics and traces, and replacement of Promtail with Vector for log collection</li> <li>Replacing Sidekiq with SolidJob, and more importantly, moving instrumentation to ActiveJob to support any background processing backend</li> <li>Rails version was upgraded to 8 and Ruby to 3.4</li> </ul>]]></content><author><name></name></author><category term="observability"/><category term="Ruby"/><category term="Ruby"/><category term="Ruby on Rails"/><category term="Kamal"/><category term="logs"/><category term="metrics"/><category term="traces"/><category term="OpenTelemetry"/><category term="OpenTelemetry Collector"/><category term="Vector"/><category term="Prometheus"/><category term="Loki"/><category term="Grafana"/><summary type="html"><![CDATA[Observability is becoming a standard. Cloud observability providers deliver a high-end solutions for the storage and visualization of the telemetry data. Yet, application owners may consider an entirely in-house approach. Here is how you can achieve it for a Ruby on Rails app.]]></summary></entry><entry><title type="html">Collecting Prometheus metrics from multi-process web servers, the Ruby case</title><link href="https://mkaz.me/blog/2023/collecting-metrics-from-multi-process-web-servers-the-ruby-case/" rel="alternate" type="text/html" title="Collecting Prometheus metrics from multi-process web servers, the Ruby case"/><published>2023-09-01T16:00:00+00:00</published><updated>2023-09-01T16:00:00+00:00</updated><id>https://mkaz.me/blog/2023/collecting-metrics-from-multi-process-web-servers-the-ruby-case</id><content type="html" xml:base="https://mkaz.me/blog/2023/collecting-metrics-from-multi-process-web-servers-the-ruby-case/"><![CDATA[<p>In Prometheus, metrics collection must follow concrete rules. For example, counters must be either always monotonically increasing or reset to zero. Violating this rule will result in collecting nonsensical data.</p> <p>It is a challenge with multi-process web servers (like Unicorn or Puma in Ruby or Gunicorn in Python) where each scrape might reach a different instance of the app which holds a local copy of the metric<sup><a href="#footnotes">[1]</a></sup>. These days, horizontal autoscaling and threaded web servers only increase the complexity of the problem. Typical solutions - implementing synchronization for scrapes or adding extra labels to initiate new time series for every instance of the app - can’t always be implemented.</p> <p>In this article I describe <em>a rebellious</em> solution of the problem which <strong>combines <a href="https://github.com/statsd/statsd">StatsD</a> for metric collection and aggregation with <a href="https://prometheus.io/">Prometheus</a> for time series storage and data retrieval.</strong></p> <hr/> <h2 id="contents">Contents</h2> <ul> <li><a href="#1-the-problem">1. The problem</a></li> <li> <a href="#2-the-proposed-solution">2. The proposed solution</a> <ul> <li><a href="#21-in-theory">2.1. In theory</a></li> <li><a href="#22-in-practice">2.2. In practice</a></li> </ul> </li> <li><a href="#3-trade-offs">3. Tradeoffs</a></li> <li><a href="#4-final-thoughts">4. Final thoughts</a></li> </ul> <hr/> <h2 id="1-the-problem">1. The problem</h2> <p>In an ideal world, the target that Prometheus scrapes is a long-living process that has the full picture of the instrumented app. Such a process can infrequently be restarted causing the local registry of metrics to reset. In this world, everything works OK.</p> <p>However, it gets complicated when the target’s <code class="language-plaintext highlighter-rouge">/metrics</code> endpoint is served by a pool of processes (workers or pods). Then, in order to render a full picture of the app at a scrape, processes must have some means of synchronization or other ability to gather the collected data from each other. In other words, the client aggregation becomes a challenge.</p> <p><a href="/assets/img/2023-09-01-collecting-metrics-from-multi-process-web-servers-the-ruby-case/scraping_workers.png"> <img src="/assets/img/2023-09-01-collecting-metrics-from-multi-process-web-servers-the-ruby-case/scraping_workers.png" alt="simple prometheus queries dashboard" style="max-width: 100%"/> </a></p> <p>This is the reason why the <a href="https://github.com/prometheus/client_python" target="_blank">Python Prometheus client</a> uses <code class="language-plaintext highlighter-rouge">mmap</code> or the <a href="https://github.com/PromPHP/prometheus_client_php" target="_blank">PHP Prometheus client</a> recommends running Redis next to the app instance.<sup><a href="#footnotes">[2]</a></sup></p> <p><u>In Ruby space</u>, a lot has been said already. The original GitHub Issue - <a href="https://github.com/prometheus/client_ruby/issues/9">Support pre-fork servers</a> - was opened on the <code class="language-plaintext highlighter-rouge">Feb 8, 2015</code> and closed on the <code class="language-plaintext highlighter-rouge">Jun 25, 2019</code>. The issue was resolved by the introduction of a new data store <code class="language-plaintext highlighter-rouge">DirectFileStore</code> - a solution where each process gets a file where it dumps its registry. Then, at a scrape, all files are read so that the data can be aggregated. <br/>I remember watching the thread closely. At that time I was fortunate to work on a Ruby web server running over 100 processes. Unfortunately, switching my (excessively) multi-process app to the new data store made scrapes very slow, eventually leading to timeouts. I wasn’t an outlier, till today I can see that half of the open issues in the <a href="https://github.com/prometheus/client_ruby">prometheus/client_ruby</a> gem relate to <code class="language-plaintext highlighter-rouge">DirectFileStore</code>. <br/>Also, the solution requires all the app instances to be able to access the same volume. It puts certain scenarios of horizontal autoscaling in question. <br/>I was forced to look for other solutions, even though I’m still watching issues related to <code class="language-plaintext highlighter-rouge">DirectFileStore</code> and I keep my fingers crossed.</p> <p>Another intuitive solution (which deserves a mention) is to <em>dynamically</em> add an extra label per metric in every app’s instance serving the <code class="language-plaintext highlighter-rouge">/metrics</code> endpoint. Such a label uniquely represents the metrics registry. It could be the process PID and/or pod name. However, this is a shortsighted solution soon leading to a blow-up of the total number of time series that Prometheus has to maintain. Adding a <em>volatile</em> label (effectively adding a new time series) is not the right tool for this problem. Especially, when it was not meant to ever group by this label.</p> <h2 id="2-the-proposed-solution">2. The proposed solution</h2> <p>In a nutshell, the proposed solution is to delegate the metrics aggregation to StatsD which then exports metrics in the Prometheus format. I’m not bringing novelty - this bridge has already been implemented as <a href="https://github.com/prometheus/statsd_exporter">statsd_exporter</a>. It’s been serving me very well in various setups, hence the praise.</p> <h3 id="21-in-theory">2.1. In theory</h3> <p>The key difference between using StatsD instead of Prometheus <u>client</u> is where the aggregation happens. The StatsD client sends UDP packets to the collector which aggregates received signals, while the Prometheus client aggregates metrics in the app’s runtime and then exposes it for scrapes (or sends to the PushGateway).</p> <p><a href="/assets/img/2023-09-01-collecting-metrics-from-multi-process-web-servers-the-ruby-case/sending_statsd_signals.png"> <img src="/assets/img/2023-09-01-collecting-metrics-from-multi-process-web-servers-the-ruby-case/sending_statsd_signals.png" alt="simple prometheus queries dashboard" style="max-width: 100%"/> </a></p> <h3 id="22-in-practice">2.2. In practice</h3> <p>There’re very few changes needed for this solution.</p> <ul> <li> <p>deploy the <code class="language-plaintext highlighter-rouge">statsd_exporter</code>; a simple <code class="language-plaintext highlighter-rouge">docker-compose</code> based deployment could include:</p> <div class="language-yaml highlighter-rouge"><div class="highlight"><pre class="highlight"><code><span class="na">statsd-exporter</span><span class="pi">:</span>
  <span class="na">image</span><span class="pi">:</span> <span class="s">prom/statsd-exporter:v0.24.0</span> <span class="c1"># check for the latest</span>
  <span class="na">ports</span><span class="pi">:</span>
    <span class="pi">-</span> <span class="s">9102:9102</span>
    <span class="pi">-</span> <span class="s">9125:9125/udp</span>
</code></pre></div> </div> <p>In the future, you might want to add custom configurations, like specific quantiles or label mappings. For more details, check out the <a href="https://github.com/prometheus/statsd_exporter#metric-mapping-and-configuration">Metric Mapping and Configuration</a> section.</p> </li> <li>use the <a href="https://github.com/Shopify/statsd-instrument">statsd-instrument</a> gem in the app; <ul> <li>make sure that required env vars are provided: <ul> <li><code class="language-plaintext highlighter-rouge">STATSD_ADDR</code> should be set to <code class="language-plaintext highlighter-rouge">statsd-exporter:9125</code></li> <li><code class="language-plaintext highlighter-rouge">STATSD_ENV</code> should be set to <code class="language-plaintext highlighter-rouge">production</code>; if not provided, then StatsD will fallback to <code class="language-plaintext highlighter-rouge">RAILS_ENV</code> or <code class="language-plaintext highlighter-rouge">ENV</code></li> </ul> </li> <li>now, adding a counter to the codebase is as easy as: <div class="language-ruby highlighter-rouge"><div class="highlight"><pre class="highlight"><code><span class="no">StatsD</span><span class="p">.</span><span class="nf">increment</span><span class="p">(</span><span class="s1">'rack_server_requests_total'</span><span class="p">,</span> <span class="ss">tags: </span><span class="p">{</span> <span class="o">...</span> <span class="p">})</span>
</code></pre></div> </div> </li> <li>alternatively, for a quick start check out my gem for Rack instrumentation: <strong><a href="https://github.com/michal-kazmierczak/statsd-rack-instrument">statsd-rack-instrument</a></strong></li> </ul> </li> <li> <p>point Prometheus to scrape the StatsD exporter, add to your <code class="language-plaintext highlighter-rouge">prometheus.yml</code>:</p> <div class="language-yaml highlighter-rouge"><div class="highlight"><pre class="highlight"><code><span class="na">scrape_configs</span><span class="pi">:</span>
  <span class="pi">-</span> <span class="na">job_name</span><span class="pi">:</span> <span class="s">statsd</span>
    <span class="na">static_configs</span><span class="pi">:</span>
      <span class="pi">-</span> <span class="na">targets</span><span class="pi">:</span>
        <span class="pi">-</span> <span class="s">statsd-exporter:9102</span>
</code></pre></div> </div> </li> </ul> <p>That’s it! You should be able to see all metrics delivered via StatsD with this PromQL query:</p> <div class="language-plaintext highlighter-rouge"><div class="highlight"><pre class="highlight"><code>sum by (__name__) ({job="statsd"})
</code></pre></div></div> <h2 id="3-trade-offs">3. Trade-offs</h2> <p>The proposed solution doesn’t come without costs. As a thought experiment, I came up with three areas on which it can be criticized:</p> <blockquote> <p>It requires an additional service to be added to your fleet of services</p> </blockquote> <p>I agree this is a disadvantage. As a matter of fact, if you have a service of <code class="language-plaintext highlighter-rouge">0.99</code> reliability and you add another service of the same high reliability, then the reliability of your system drops to <code class="language-plaintext highlighter-rouge">0.99 * 0.99 = 0.9801</code>. Yet, I have never encountered any issue with the StatsD server. It has proven to be very reliable.</p> <hr/> <blockquote> <p>Incrementing a counter requires sending a UDP packet in contrary to fast in-memory update</p> </blockquote> <p>On the same note, let me pull the quote from the <code class="language-plaintext highlighter-rouge">"Prometheus: Up &amp; Running"</code> book<sup><a href="#footnotes">[3]</a></sup>:</p> <blockquote> <p>Performance is vital for client libraries. This excludes designs where work processes send UDP packets or any other use of networks, due to the system call overhead it would involve. What is needed is something that is about as fast as normal instrumentation, which means something that is as fast as local process memory but can be accessed by other processes.</p> </blockquote> <p>I fully understand the motivation. Probably it holds true for most of the languages. Yet, at least for Ruby, I think it has proven that the client aggregation isn’t the optimal solution.</p> <hr/> <blockquote> <p>Soon, you might have many applications sending metrics to a single StatsD server making it a bottleneck</p> </blockquote> <p>This is a reminder to add the monitoring of the StatsD server. Even though I think that reaching the scale when it becomes a bottleneck is limited to very few.</p> <h2 id="4-final-thoughts">4. Final thoughts</h2> <p>Despite the recommendation from the <a href="https://github.com/prometheus/statsd_exporter#overview"><code class="language-plaintext highlighter-rouge">statsd_exporter</code></a> repository:</p> <blockquote> <p>We recommend using the exporter only as an intermediate solution, and switching to native Prometheus instrumentation in the long term.</p> </blockquote> <p>I don’t see the need of migrating from the described solution. If I ever find and migrate to a more suitable solution, then I’ll describe it and update this post.</p> <p>Currently, the <a href="https://opentelemetry.io/">OpenTelemetry</a> project catches a lot of my attention. It offers an integrated approach for gathering app’s signals (logs, metrics, traces). However, the <a href="https://github.com/open-telemetry/opentelemetry-collector">OpenTelemetry Collector</a> doesn’t feature server-side metric aggregation yet - currently it’s an <a href="https://github.com/open-telemetry/opentelemetry-collector-contrib/issues/4968">open proposal</a>. Assuming it’s accepted and implemented one day, it may take a long time until it’s available in the client SDKs.</p> <hr/> <h2 id="footnotes">Footnotes</h2> <ol> <li>The problem of collecting metrics from multi-process web servers I know from my own experience, therefore I focus on it. However, I think that collecting metrics from short-living executions (such as GCP functions or AWS labdas) is a sibling problem that might be solved in the same manner.</li> <li>It is interesting how seemingly similar problems are approached differently in different languages.</li> <li><code class="language-plaintext highlighter-rouge">Prometheus: Up &amp; Running</code> by Brian Brazil, ISBN: 9781492034094, page 66.</li> </ol> <p>I have found <a href="https://github.com/zapier/prom-aggregation-gateway">prom-aggregation-gateway</a> which is also a method for delegating aggregation while still using Prometheus client in the app. To be honest, I haven’t tried it but I feel obliged to mention it in the context of this post.</p> ]]></content><author><name></name></author><category term="Ruby"/><category term="monitoring"/><category term="Prometheus"/><category term="StatsD"/><category term="metrics"/><category term="Ruby"/><category term="Rack"/><category term="Puma"/><summary type="html"><![CDATA[In Prometheus, metrics collection must follow concrete rules. It is a challenge with multi-process web servers where each scrape might reach a different instance of the app which holds a local copy of the metric. In this article I describe a rebellious solution of which combines StatsD with Prometheus.]]></summary></entry><entry><title type="html">Simple Prometheus queries for metrics inspection</title><link href="https://mkaz.me/blog/2023/simple-prometheus-queries-for-metrics-inspection/" rel="alternate" type="text/html" title="Simple Prometheus queries for metrics inspection"/><published>2023-08-13T18:18:00+00:00</published><updated>2023-08-13T18:18:00+00:00</updated><id>https://mkaz.me/blog/2023/simple-prometheus-queries-for-metrics-inspection</id><content type="html" xml:base="https://mkaz.me/blog/2023/simple-prometheus-queries-for-metrics-inspection/"><![CDATA[<p><a href="https://www.robustperception.io/cardinality-is-key/">Cardinality is key</a>. And it’s easy to get it out of control, as it is with any instance of the <a href="https://en.wikipedia.org/wiki/Combinatorial_explosion#Computing">combinatorial explosion</a>.</p> <p>This, combined with the claim that 90% of metrics are never accessed<sup><a href="#footnotes">[1]</a></sup>, creates an area worth exploring.</p> <p>Observability cloud vendors already provide tools allowing to inspect unused data and eventually reduce the cost<sup><a href="#footnotes">[2]</a></sup>. But how to get a sense of your metrics when you don’t have access to such tools (i.e. when you run your own Prometheus server)?</p> <p>This article proposes a set of simple queries which allow to detect heavy metrics. For a fine illustration of the results, there’s also a Grafana dashboard proposition. A sneak peek of the dashboard is presented on the below screenshot.</p> <p><a href="/assets/img/2023-08-13-simple-prometheus-queries-for-metrics-inspection/simple_prometheus_queries_dashboard_20241013.png"> <img src="/assets/img/2023-08-13-simple-prometheus-queries-for-metrics-inspection/simple_prometheus_queries_dashboard_20241013.png" alt="simple prometheus queries dashboard" style="max-width: 100%"/> </a></p> <hr/> <h2 id="contents">Contents</h2> <ul> <li><a href="#a-short-theory-intro">1. A short theory intro</a></li> <li> <a href="#2-queries">2. Queries</a> <ul> <li><a href="#21-the-count-of-all-series">2.1. The count of all series</a></li> <li><a href="#22-the-count-of-all-metrics">2.2. The count of all metrics</a></li> <li><a href="#23-the-count-of-all-jobs">2.3. The count of all jobs</a></li> <li><a href="#24-the-count-of-series-per-metric">2.4. The count of series per metric</a></li> <li><a href="#25-the-count-of-series-per-job">2.5. The count of series per job</a></li> </ul> </li> <li><a href="#3-grafana-dashboard">3. Grafana dashobard</a></li> </ul> <hr/> <h2 id="1-a-short-theory-intro">1. A short theory intro</h2> <p>In short, the cardinality of a label is the number of distinct values that were observed. A metric’s cardinality is the number of all observed combinations of labels’ values. In the worst case, it is the product of all labels’ cardinalities.</p> <p>A fine example is a metric counting HTTP requests having <code class="language-plaintext highlighter-rouge">path</code>, <code class="language-plaintext highlighter-rouge">method</code> and <code class="language-plaintext highlighter-rouge">response_code</code> labels. Let’s consider a scenario in which five paths are observed with three methods and three response codes. Then, the cardinality is <code class="language-plaintext highlighter-rouge">5 * 3 * 3 = 45</code>.</p> <p>If we decide to make <em>a subtle</em> change and turn this counter into histogram (with 12 buckets), short in time our metric may grow to the cardinality of <code class="language-plaintext highlighter-rouge">45 * 12 = 540</code>.</p> <h2 id="2-queries">2. Queries</h2> <p>Beware, when running the queries it’s important to run an <em>instant query</em>, not <em>range query</em>, as for the purpose of this article the last recorded value is enough - we are not interested in the change over time. Querying for a <em>range query</em> may be very slow.</p> <p>Without further ado, let’s dive into details.</p> <p><a href="/assets/img/2023-08-13-simple-prometheus-queries-for-metrics-inspection/simple_prometheus_queries_dashboard_with_marks_20241013.png"> <img src="/assets/img/2023-08-13-simple-prometheus-queries-for-metrics-inspection/simple_prometheus_queries_dashboard_with_marks_20241013.png" alt="simple prometheus queries dashboard with metrics marks" style="max-width: 100%"/> </a></p> <h3 id="21-the-count-of-all-series">2.1. The count of all series</h3> <p>For starters, let’s pull the total number of series. That is the count of all unique label combinations (including the <code class="language-plaintext highlighter-rouge">__name__</code> label).</p> <div class="language-plaintext highlighter-rouge"><div class="highlight"><pre class="highlight"><code>count({__name__!=""})
</code></pre></div></div> <p>This query relies on one simple rule: Prometheus Query Language (PromQL) requires to provide either a metric name or at least one label matcher. <code class="language-plaintext highlighter-rouge">__name__</code> is an internal label added to every metric with the value of the metric name. As a metric name cannot be empty the <code class="language-plaintext highlighter-rouge">!=""</code> expression selects all the metrics.</p> <p>This powerful concept will be reused in further queries.</p> <h3 id="22-the-count-of-all-metrics">2.2. The count of all metrics</h3> <p>Now, let’s check how many metrics our Prometheus instance maintenances.</p> <div class="language-plaintext highlighter-rouge"><div class="highlight"><pre class="highlight"><code>count(count({__name__!=""}) by (__name__))
</code></pre></div></div> <p>Nothing out of ordinary, it’s just a grouping the previous query by <code class="language-plaintext highlighter-rouge">__name__</code> and counting it.</p> <h3 id="23-the-count-of-all-jobs">2.3. The count of all jobs</h3> <p>Similarly, let’s check the number of jobs that produce metrics.</p> <div class="language-plaintext highlighter-rouge"><div class="highlight"><pre class="highlight"><code>count(count({__name__!=""}) by (job))
</code></pre></div></div> <p>It’s the same query as the previous just from a different angle - grouped by the <code class="language-plaintext highlighter-rouge">job</code> label.</p> <h3 id="24-the-count-of-series-per-metric">2.4. The count of series per metric</h3> <p>Now let’s zoom in a bit and see more detailed data.</p> <div class="language-plaintext highlighter-rouge"><div class="highlight"><pre class="highlight"><code>sort_desc(
    count({__name__!=""}) by (__name__)
)
</code></pre></div></div> <p>This query outputs the number of series <ins>per metric</ins>. It is useful to spot metrics with high cardinality. With the <code class="language-plaintext highlighter-rouge">sort_desc</code> we can see the most interesting results at the top.</p> <h3 id="25-the-count-of-series-per-job">2.5. The count of series per job</h3> <p>Again similarly, let’s change the grouping to <code class="language-plaintext highlighter-rouge">job</code>.</p> <div class="language-plaintext highlighter-rouge"><div class="highlight"><pre class="highlight"><code>sort_desc(
    count({__name__!=""}) by (job)
)
</code></pre></div></div> <p>The output shows the number of series <ins>per job</ins>. It may reveal that a certain job (very often representing a single scraping target) is producing disproportionately many series.</p> <h2 id="3-grafana-dashboard">3. Grafana dashboard</h2> <p>Staring at dashboards is amusing. Therefore I couldn’t resist building a dashboard based on the above queries. Besides numbers described above, it has more accompanying calculations, like the percentage that a metric shares out of all series. Check it out at <a href="https://grafana.com/grafana/dashboards/19341-prometheus-metrics-management/">https://grafana.com/grafana/dashboards/19341-prometheus-metrics-management/</a>.<sup><a href="#footnotes">[3]</a></sup></p> <hr/> <h2 id="footnotes">Footnotes</h2> <ol> <li><em>“Lightstep has studied customers especially for metrics (…) - one in ten metrics is ever queried for any purpose.”</em> Ben Sigelman, Lighstep CEO on OpenObservability Talks, <a href="https://www.youtube.com/live/gJhzwP-mZ2k?feature=share&amp;t=1902">https://www.youtube.com/live/gJhzwP-mZ2k?feature=share&amp;t=1902</a></li> <li>If you are a happy user of Grafana Cloud, check out <a href="https://grafana.com/docs/grafana-cloud/account-management/billing-and-usage/control-prometheus-metrics-usage/cardinality-management/">cardinality management dashboards</a></li> <li>There’s also Gist with the dashboard as a backup <a href="https://gist.github.com/michal-kazmierczak/1538bd8df46e4a1fbf9c859bfa045126" target="_blank">https://gist.github.com/michal-kazmierczak/1538bd8df46e4a1fbf9c859bfa045126</a>.</li> </ol> ]]></content><author><name></name></author><category term="monitoring"/><category term="Prometheus"/><category term="PromQL"/><category term="metrics"/><category term="labels"/><category term="cardinality"/><category term="Grafana"/><summary type="html"><![CDATA[Cardinality is key. And it’s easy to get it out of control. Check out a proposal on how to inspect your metrics with simple Prometheus queries and tune your instrumentation.]]></summary></entry></feed>